14 Dez. Basic OpenEdge DB Tuning: -B / Cache
Tuning an OpenEdge DB on basic level requires only a few parameters to be considered.
The -B is the most valuable parameter. When set to 100 000 (one hundred throusand) the DB will use 100000 times the size of a DB block as a cache. Often enough the -B parameter is not set or much too small.

PART 1 – BASE SETTING OF -B
Tuning an OpenEdge DB on basic level requires only a few parameters to be considered.
The -B is the most valuable parameter. When set to 100 000 (one hundred thousand) the DB will use 100000 times the size of a DB block as a cache. Often enough the -B parameter is not set or much too small.
Hint: The resulting size is multiple of DB blocks, which can be in the range from 1 to 8 KB.
Sample: With 1 Kb block size and -B 5000 result is 5 MB and with 8 KB block size the result is 40 MB.
Important points:
-
-
- A 32 Bit DB can use 1.x GB as cache, a 64 Bit DB can use nearby unlimited RAM
- Most reads in daily work must be read from cache, otherwise the DB is slow
- -B cache is 10 times faster than file system cache and much, much faster than any disc system including SSDs
- Set -B too big will make a system to swap or shut down
-
Sample: A 50 GB DB should have 5 GB, better 10 GB -B
Where to set:
-
-
- Command DB start like “proserve mydb -B 100000“
- In DB pf File (mydb.pf)
- In OpenEdge Explorer/Management (default: http://localhost:9090), option is named “Blocks in database buffers (primary)” (or similar)
(This setting is stored in the file $DLC/properties/conmgr.properties)
-
PART 2 – MEASURE EFFECTIVENESS OF -B
The rule of thumb will work for most systems. But to know it more exactly, a promon screen will help.
-
-
-
- Start “proenv” on Windows or use a shell with path set to $DLC.
- Start “promon mydb” and choose option
- Wait a few minutes – at a time with normal activity.
- Then press ENTER.
-
-

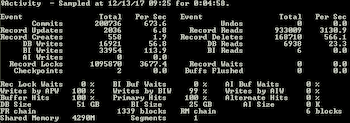
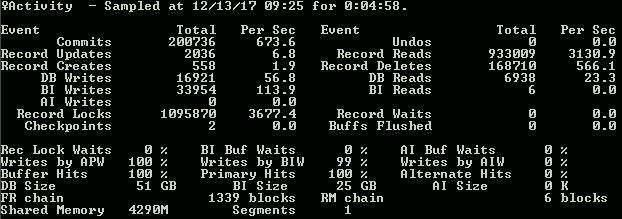
The important points are physical reads (DB Reads, 23.3/sec, right in the middle) and logical reads (Record Reads, 3130.0, upper right entry). Everything which is not in cache must be read from disk.
So 3130 is 100% of reads, 23 are read from disk, so 3107 are cached. This is around 99.x % – promon shows here “Buffer Hits 100%” – promon may calculate records not reads.
In general 98 or 99% are a good value here.
Hint: Storing 100% of DB in memory will always work good at the end, but may need days to fill the Cache
But the percentage is not the only point. The most important point is, that the disk system must be fast enough to deliver the data (DB Reads).
Rough values of random disc I/Os:
-
-
- Read/Write, Single disc 100 – 150
- Raid 1 (2 discs), read 200 – 300, writing slower
- Raid 5 (5 discs), read 400, writing poor
- Raid 10 (10 discs), read 1000, write may be the half
- More information here
-
If your disc system is fast enough can be monitored with performance monitor tool (Windows, name of tool differes from version to versio) or vmstats/nmon… on Linux, look for wait for io.
It must be said, that monitoring this in todays complex systems with VMs and storage networks may need some deeper Investigation ?
For more information on OE DB tuning see Part II: Basic OpenEdge DB Tuning Part II: BI Cluster Size
Klaus Erichen, IAP GmbH, Germany, 14 dec 2017
For questions send a mail to:


